PROFIBUS-INspektor® NT monitors the logical data exchange
Uninterrupted reading for all tasks
No additional software is required to read data from PROFIBUS-INspektor® NT. All that is needed is a web browser (such as Mozilla Firefox) to access the web interface integrated into the device. This makes it possible to see both the current network status and a history of past events.
Attention! The web interface of the PROFIBUS-INspektor® NT can be easily accessed via the browser on the connected device (for example a laptop or tablet) – without the need for additional software. No active internet connection required.
Topology function with status information
In order to be able to evaluate a PROFIBUS network, it is essential to know the actual wiring between the individual units. This topology can be stored in the PROFIBUS-INspektor® NT together with all important parts of the infrastructure, such as repeaters and measurement points, including device information, and can be retrieved when needed. In addition, the current and previous status of individual nodes is displayed in color. It makes it easier to delineate existing faults to certain segments or conspicuous nodes.
Error statistics with a more detailed timeline
It is clearly seen which unit is most often affected by events that have occurred (for example, telegram repetitions). This provides important information for troubleshooting.
Automatic alerts for PROFIBUS errors
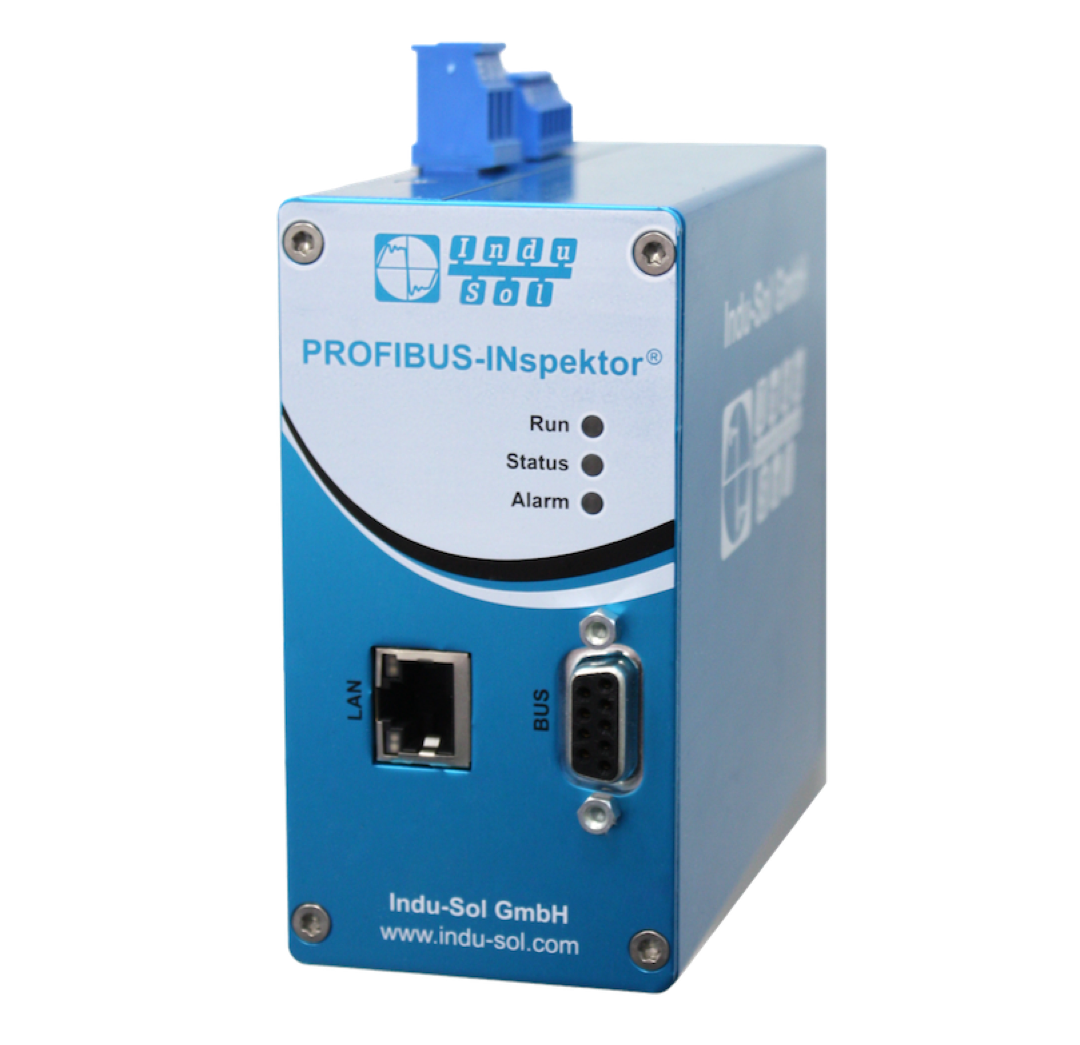
As soon as a threshold value is exceeded, the PROFIBUS-INspektor® NT alerts so that the operator is warned in time and can carry out targeted, planned maintenance measures. Warnings can be given in several ways. An LED indicator on the PROFIBUS-INspektor® NT shows immediately if errors have occurred in the network. In addition to this warning, a potential-free contact can be switched, for example to send a message directly to the control system. The third option is to send an email to inform the responsible maintenance staff as soon as possible.
Via the web interface of the PROFIBUS-INspektor® NT, a detailed alarm list provides information on which error occurred on which device together with a time stamp. In addition, which event (which threshold value) triggered the alarm is recorded. The internal memory makes it possible to register up to 2000 alarm messages, where each alarm is assigned a snapshot of up to 1000 PROFIBUS telegrams.
Warning options
► E-mail (push) ► LED-indicator
► SNMP-trap ► Switching contact
Easy creation of a PROFIBUS acceptance log
PROFIBUS-INspektor® NT makes it possible to establish a comprehensive acceptance log for your PROFIBUS project quickly and with just a few clicks. The log contains all important information about the respective PROFIBUS system, from topology to bus-related EMC conditions.
The easy way to get started with permanent network monitoring
With PROFIBUS-INspektor® NT you can easily get started with permanent network monitoring. The compact INspektor® device is the simplest solution for decentralized data collection in PROFIBUS networks. The device does not require any complicated configuration and is immediately ready to use to record all the characteristic logic quality parameters of your PROFIBUS project. Based on this, maintenance and service for your PROFIBUS system can be carried out as needed. Reduce your maintenance costs and efforts through permanent PROFIBUS monitoring with INspektor® NT from Indu-Sol.